Using the AI Infographic Generator
The AI Infographic Generator turns a dense document or a set of figures into a visual one-pager. It extracts the key data on-device, picks a suitable visual template, and renders an infographic in a side-by-side canvas you refine by chatting — “make the timeline horizontal”, “use blue and grey” — and the preview updates immediately. The source never leaves your machine.
When to use it
- A strategy memo → board one-pager — pull the key pillars and statistics into a dashboard tile, then drop the PNG into your deck.
- A project plan → timeline — turn milestones and dates into a horizontal timeline, exported as SVG for the wiki.
- A feature comparison — render two products side by side and iterate on colour and emphasis.
- A newsletter visual — turn an article draft into a “key facts” tile grid.
How to use it
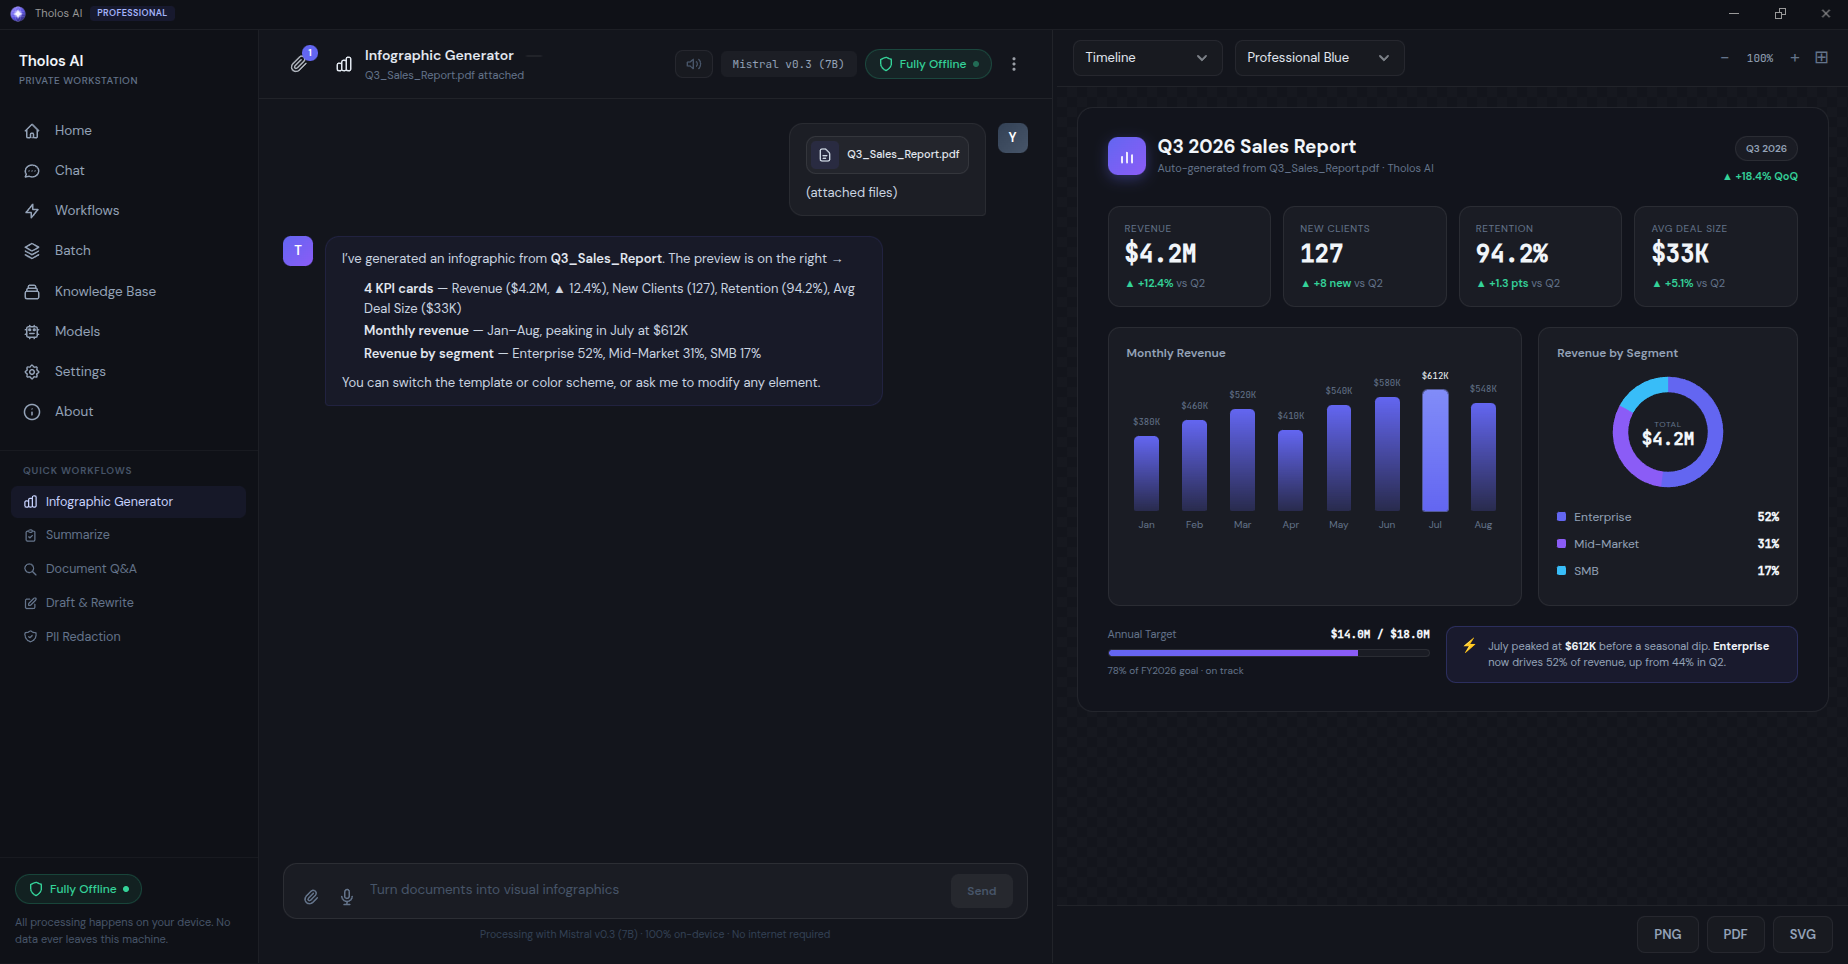
- Open the Workflows view and choose Infographic Generator. It opens the split Chat + Canvas view — chat on the left, live preview on the right.
- Attach a document or paste your text/data. The chat pane shows the model extracting structured data; the canvas shows a loading skeleton, then the rendered infographic.
- Optionally set a type, colour scheme, or a custom title before sending (see below).
- Iterate by chatting — “make the second tile blue”, “add a 2024 row”, “make the headline larger”. Each request re-renders the canvas, and your iteration history stays in the chat so you can revert.
- Export from the controls above the canvas.
Type and style
- Type — Auto-pick (the default, chosen from the shape of your data), or pick one: Timeline, Comparison, Process / Flow, Statistics, or Hierarchy.
- Colour scheme — Auto-pick, or Professional, Warm, Monochrome, or Vibrant.
- Title — leave blank to use the auto-generated title, or type your own.
Exporting
Export the finished infographic as PNG, PDF, or SVG — pick the format above the canvas and export. For print or large-format use, prefer SVG (it scales without blurring); PNG is best for slides, PDF for a standalone handout.
The Infographic Generator is part of the Professional and Business editions (and is included in the free trial).
Checking the result
- Verify every number. Compare the figures on the canvas against the source — each one should come from the document, not be invented.
- Export each format you need and open it in a third-party viewer (image viewer, browser, PDF reader) to confirm it looks right.
- If the canvas looks cramped or empty, give it a specific correction in chat — the AI usually responds well to precise instructions.
Tips
- Start with a clear, data-rich source. The model is far better at visualizing facts that are already in the document than at inventing data.
- For tougher documents, a larger model in the Models view produces better extraction and layout — see Choosing the right AI model.